Results
Implementation
The architecture of our solution is illustrated on the figure below. Our system is composed of two modules:
- Data Analytics, which handles the extraction, storage, and retrieval of knowledge;
- Multimodal Interface, which is the front-end part supporting several potential input modalities to record raw information from users and present back the results of their request.
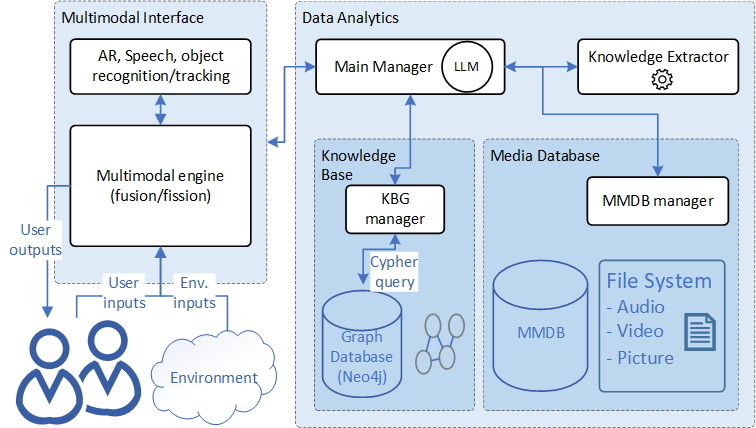
The Multimodal Interface module allows operators to interact via text, audio, or video as both input and output. A transportable interface is desirable, as operators are likely to have to move around while consulting the knowledge base. It is also important to always leave at least one hand free for the operator. The device requires microphones and cameras to record the information needed to preserve the knowledge of experienced operators. AR-based solutions as well as speech or object recognition are also considered for hand-free interactions.
The solution aims to improve access to relevant information using search and measurement tools with audio, images, and video. The interface should also involve the operators in the decision-making, information sharing process: they can send video commentaries on their actions (e.g., motivations or doubts), which can be used for reviews or to enrich the knowledge base.
Test and preliminary results
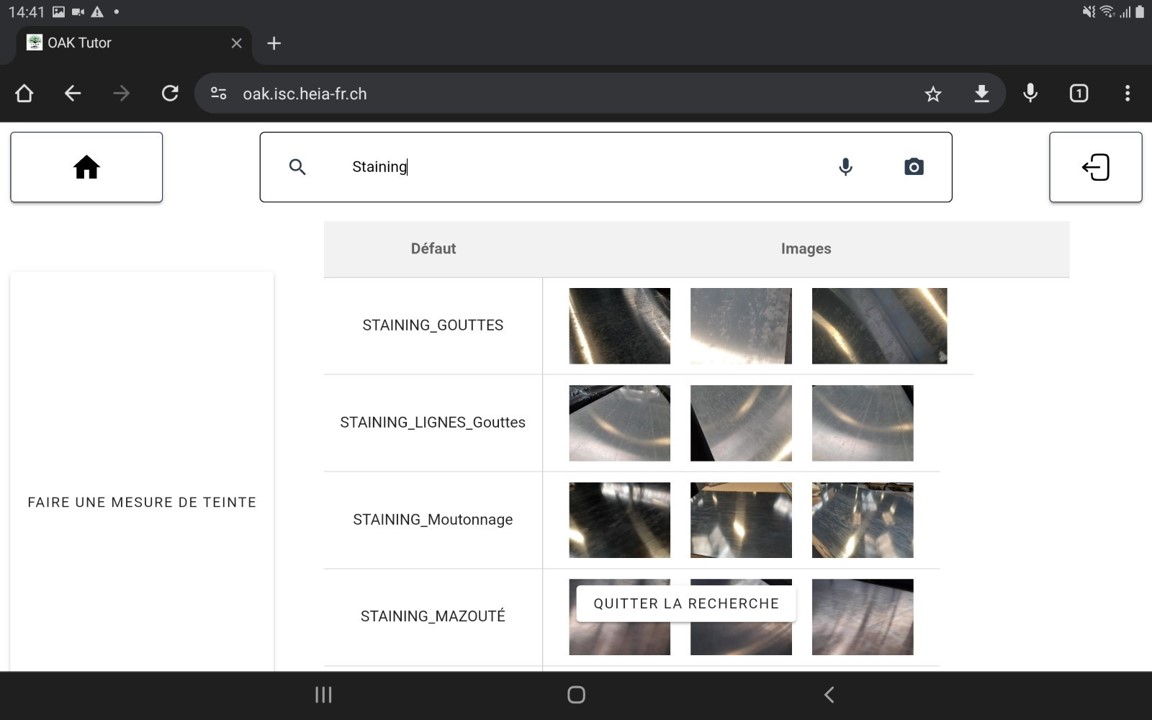
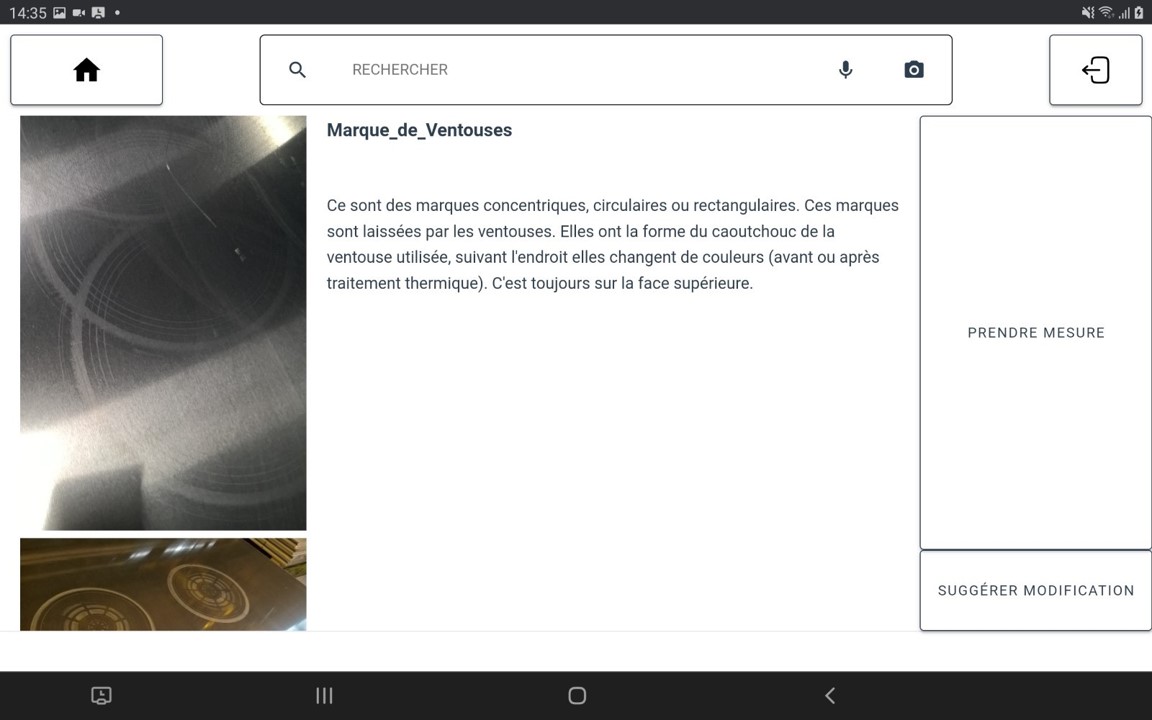
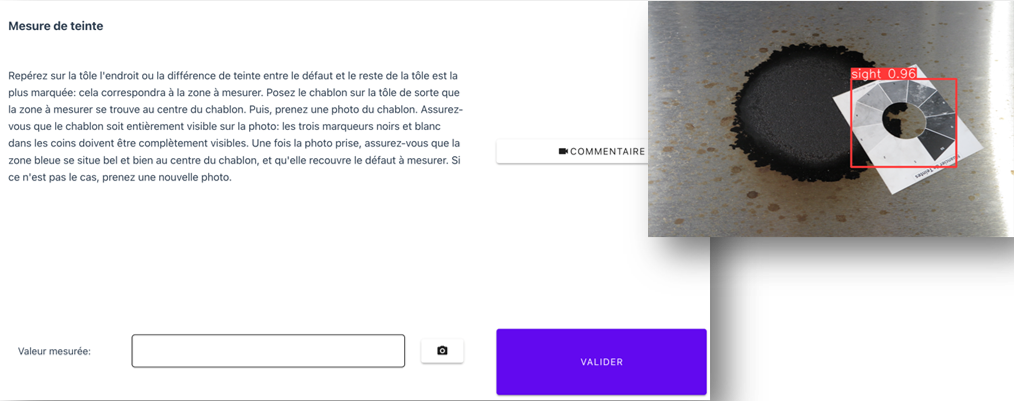
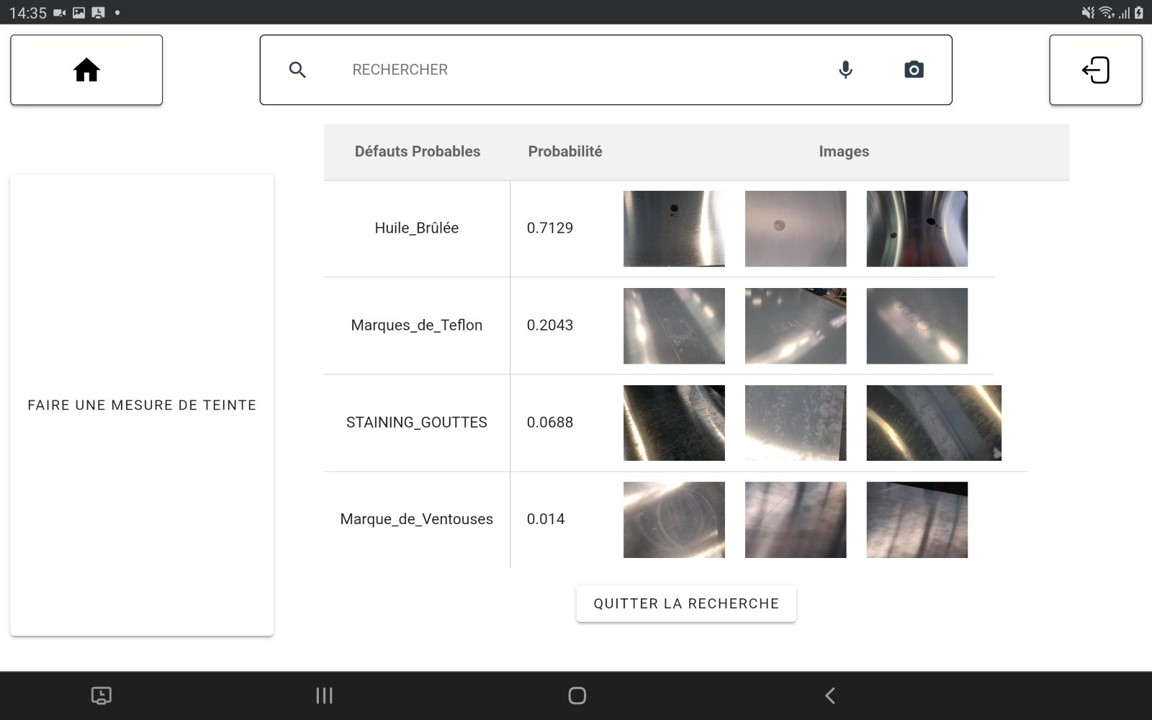
We implemented our solution in a real-world scenario: quality control of high-precision aluminum plate manufacturing. Implemented as a tablet application, our proof of concept (POC) supports operators of varying expertise in recognizing visual defects, assessing their significance, and making informed decisions (e.g., whether to scrap the entire piece). We created our knowledge base using the “defects catalog”, which is currently used in paper form on the shop floor to quickly identify defects, assess them, and guide operators in taking appropriate actions. The catalog includes short descriptions and sample images of defects.
From an operator’s point of view, the workflow is as follows:
- Scan the ID of the product where a defect is spotted.
- Recognize the defect via textual, audio, or image-based description.
- Assist in the assessment of defect severity.
- Log the measured value into the system, optionally providing an accompanying commentary.
- Receive a system suggestion concerning the conformity of the plate. The operator makes the final decision.
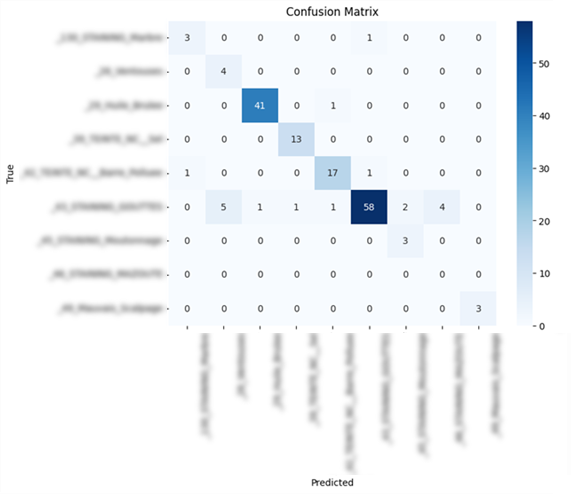
To evaluate our system, we used two distinct approaches. For the image-based search, we calculated the classifier score on a test set (Confusion matrix below) focusing on 4 representative defects selected by our industrial partner. Given the small, unbalanced dataset used to fine-tune the Xception model, the results are promising (weighted avg f1-score: 0.90).
Regarding interface evaluation, the User Experience (UEQ-S) generally averaged 1.69, with a pragmatic quality mean of 1.42 and a hedonic quality mean of 1.96. Pragmatically, operators found the application to be efficient (1.7), helpful and clear (1.5), and relatively simple (1.0). From a hedonic perspective, the solution was considered original (2.3), interesting (2.2), captivating and avant-garde (1.7).
The highlighted advantages include “time savings”, “ease of processing”, and “easier training for new colleagues”. The objectivity of measurement acquisition was also emphasized.
Stain assessment case
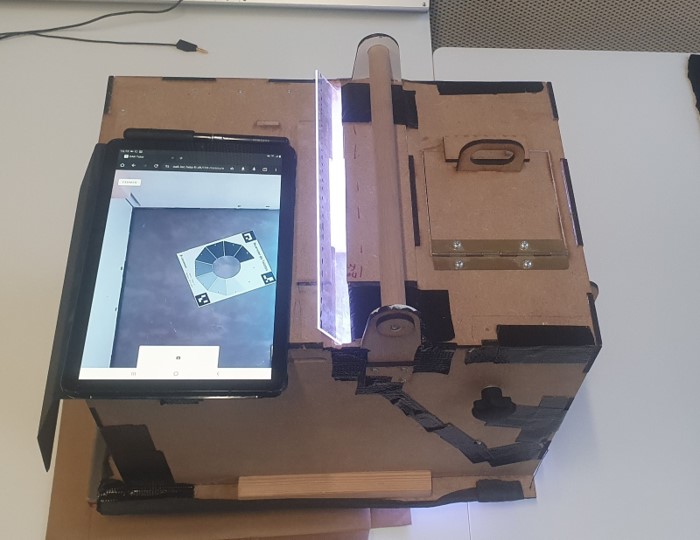
With our partner, we designed and built a prototype “measuring box” or “stain assessment case” (see below) to take photos of the highly reflective surface of aluminum sheets, while controlling the lighting and angle of the photo.
